
Figures from the book
All thirteen figures, at readable size.
The diagrams in Workflows, Decisions, Discipline are reproduced here in full colour and full size. Ereader screens are small and greyscale, so this page exists for anyone who wants to look properly.
Free to use inside your own organisation, with attribution. Ask before using them in anything you publish or sell.
The figures
Figure 01
The Business Operating System
How a business turns demand into output. Three layers: how the business runs, what makes it work, and what enables it.
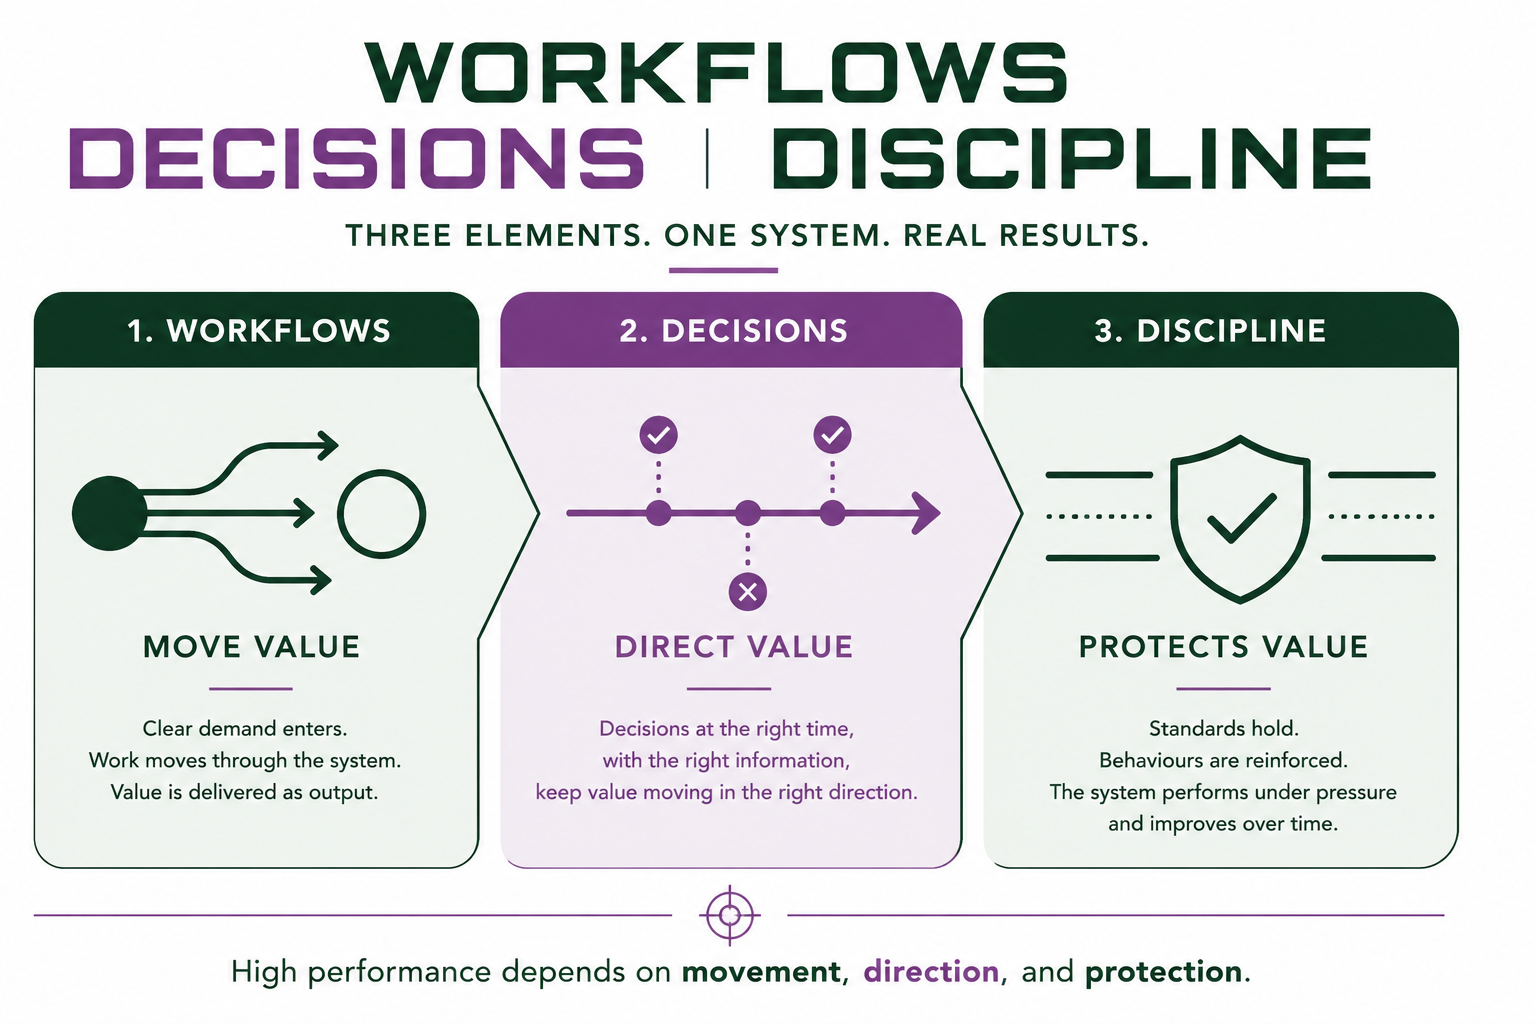
Figure 02
Workflows, Decisions, Discipline
The three elements and what each one does. Workflows move value, decisions direct it, discipline protects it.
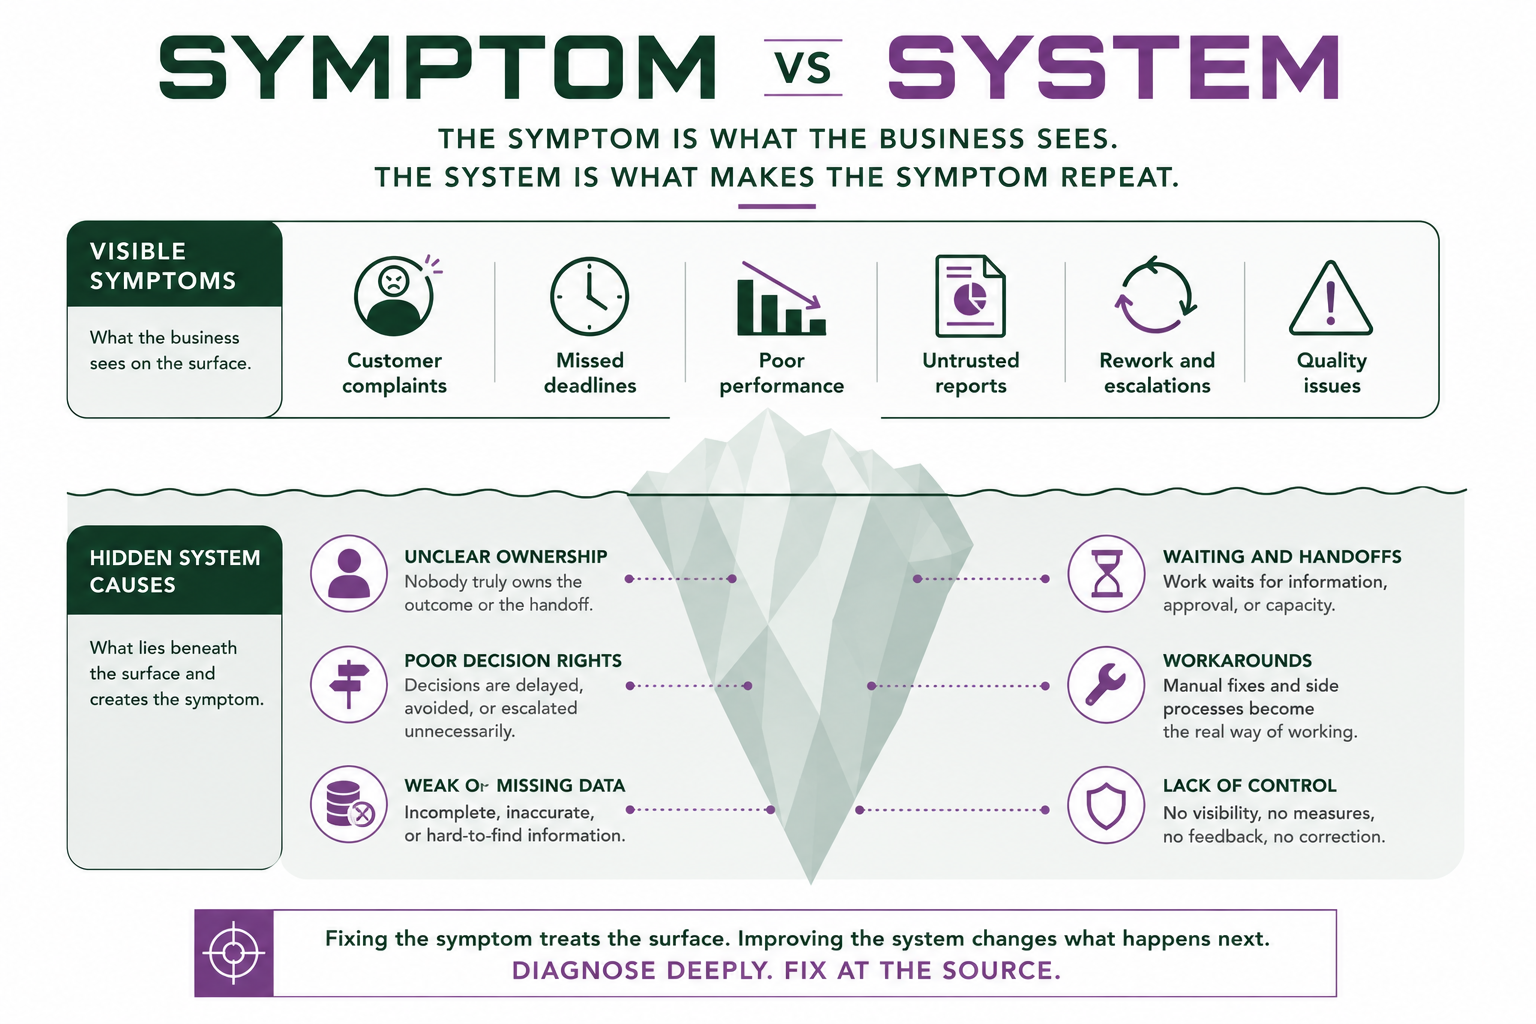
Figure 03
Symptom versus system
What the business sees on the surface, and the causes underneath that make the symptom repeat.
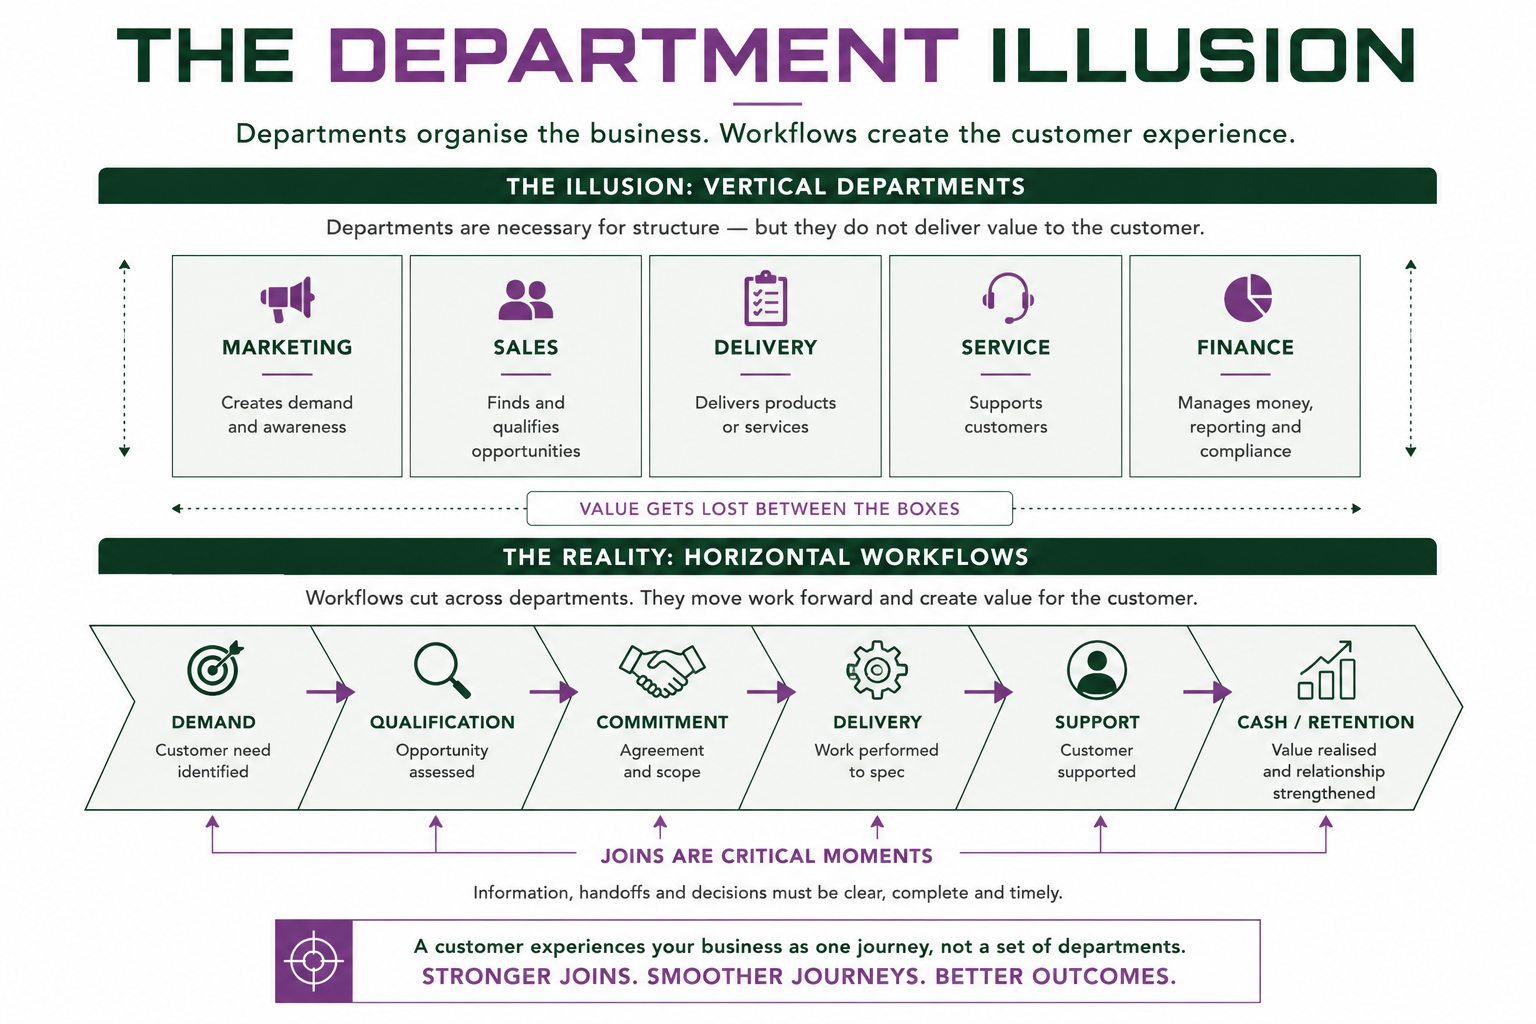
Figure 04
The department illusion
Departments organise the business. Workflows create the customer experience, and value gets lost between the boxes.
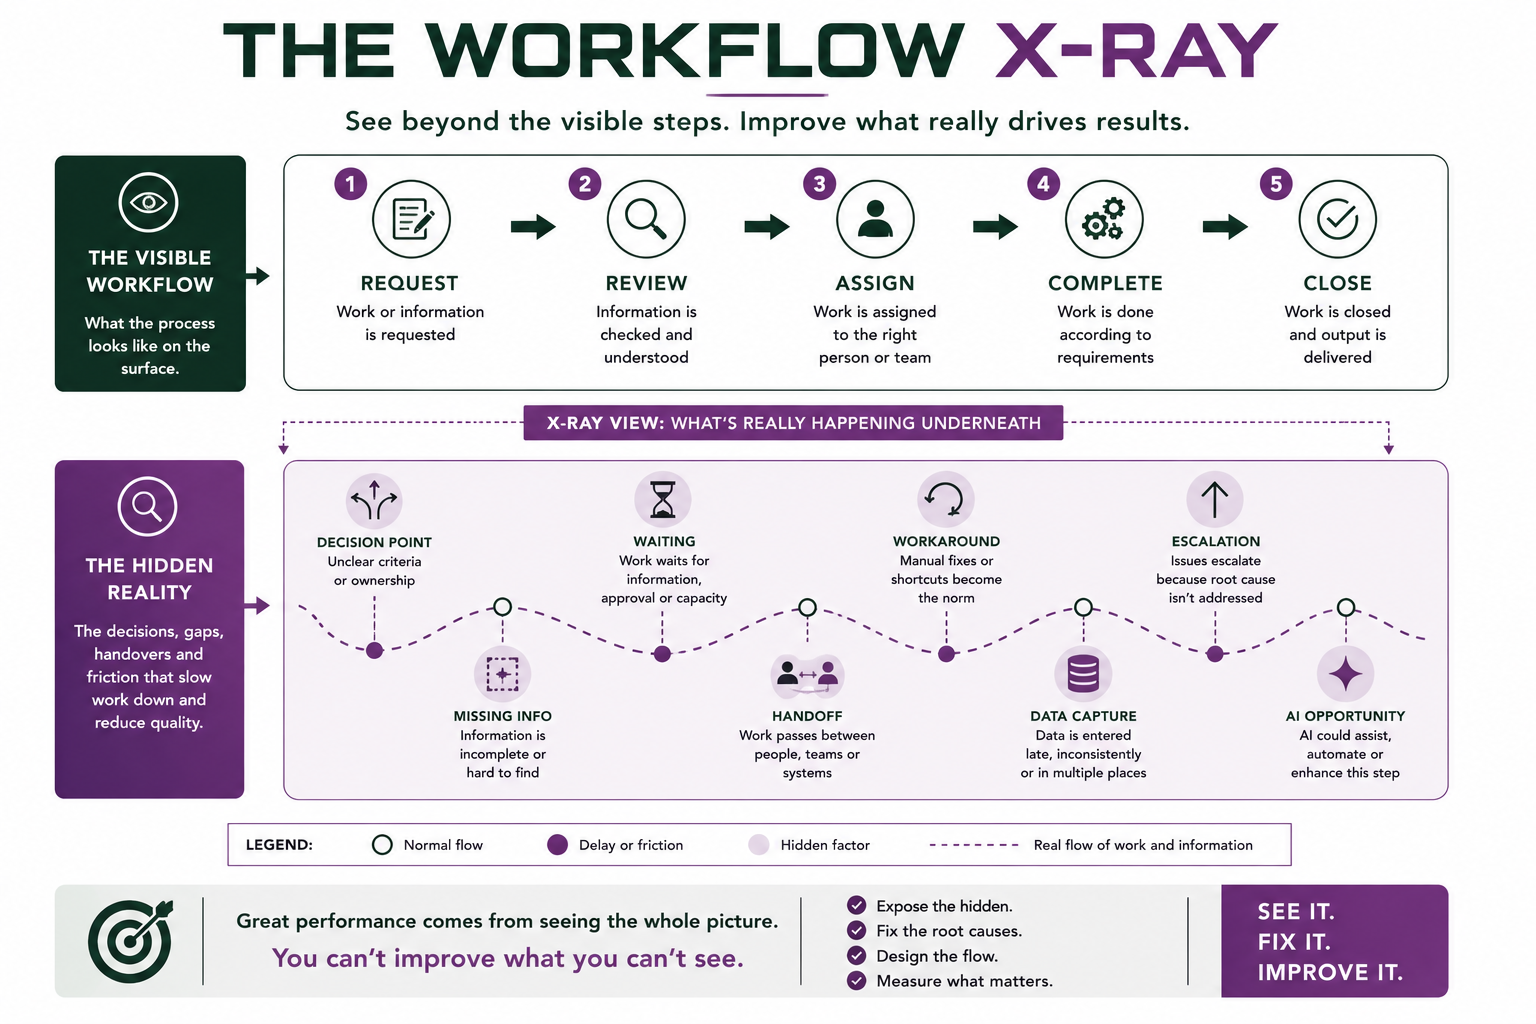
Figure 05
The workflow X-ray
The visible process, and the decisions, waiting, handoffs and workarounds happening underneath it.
Figure 06
The decision spine
Six decision points running through a workflow from demand to close, and what each one asks.
Figure 07
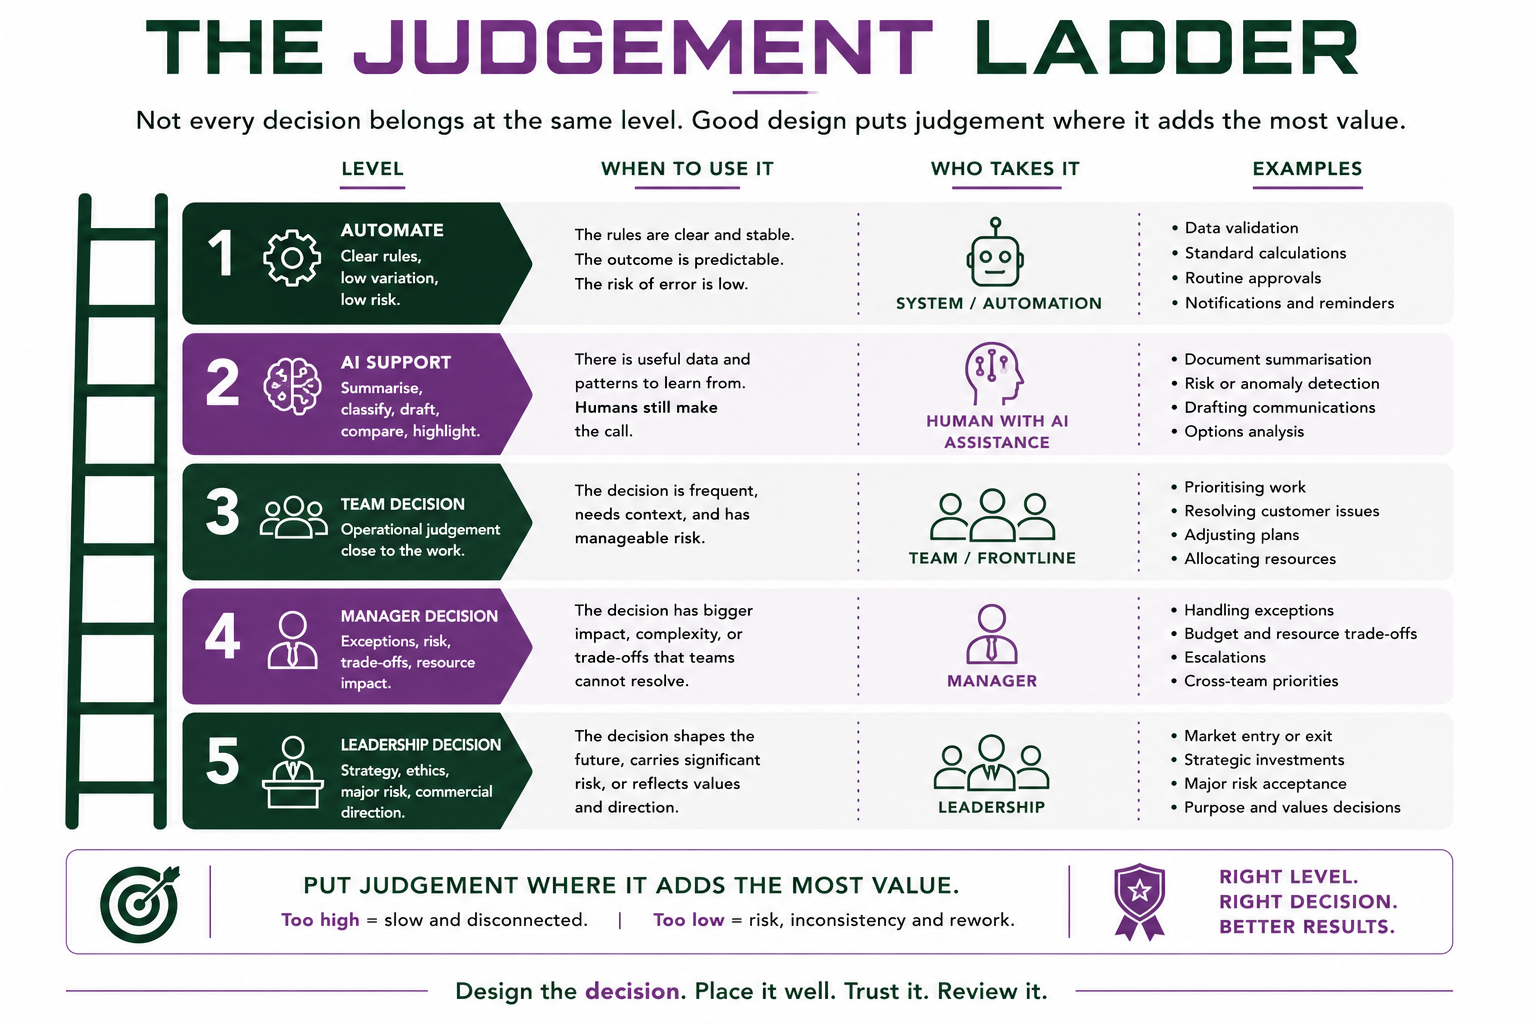
The judgement ladder
Five levels of decision, from automation to leadership, and how to tell which level a decision belongs at.
Figure 08
The information diet
Six principles for the information behind a decision, with what good and bad look like for each.
Figure 09
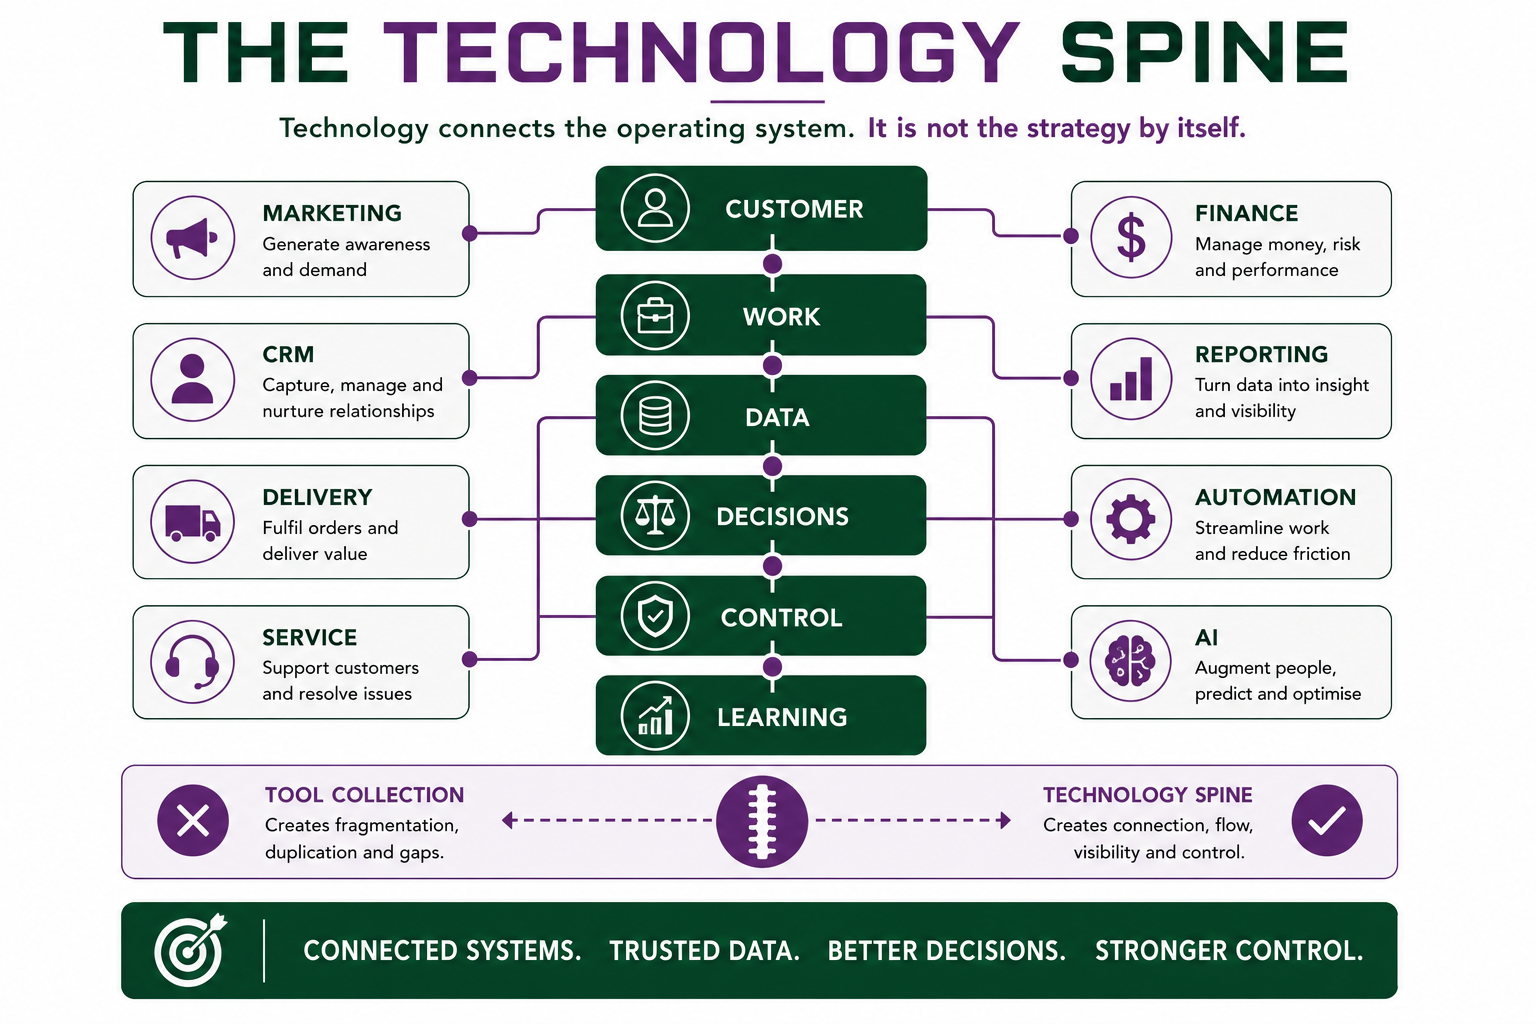
The technology spine
How systems connect the operating system, and the difference between a tool collection and a spine.
Figure 10
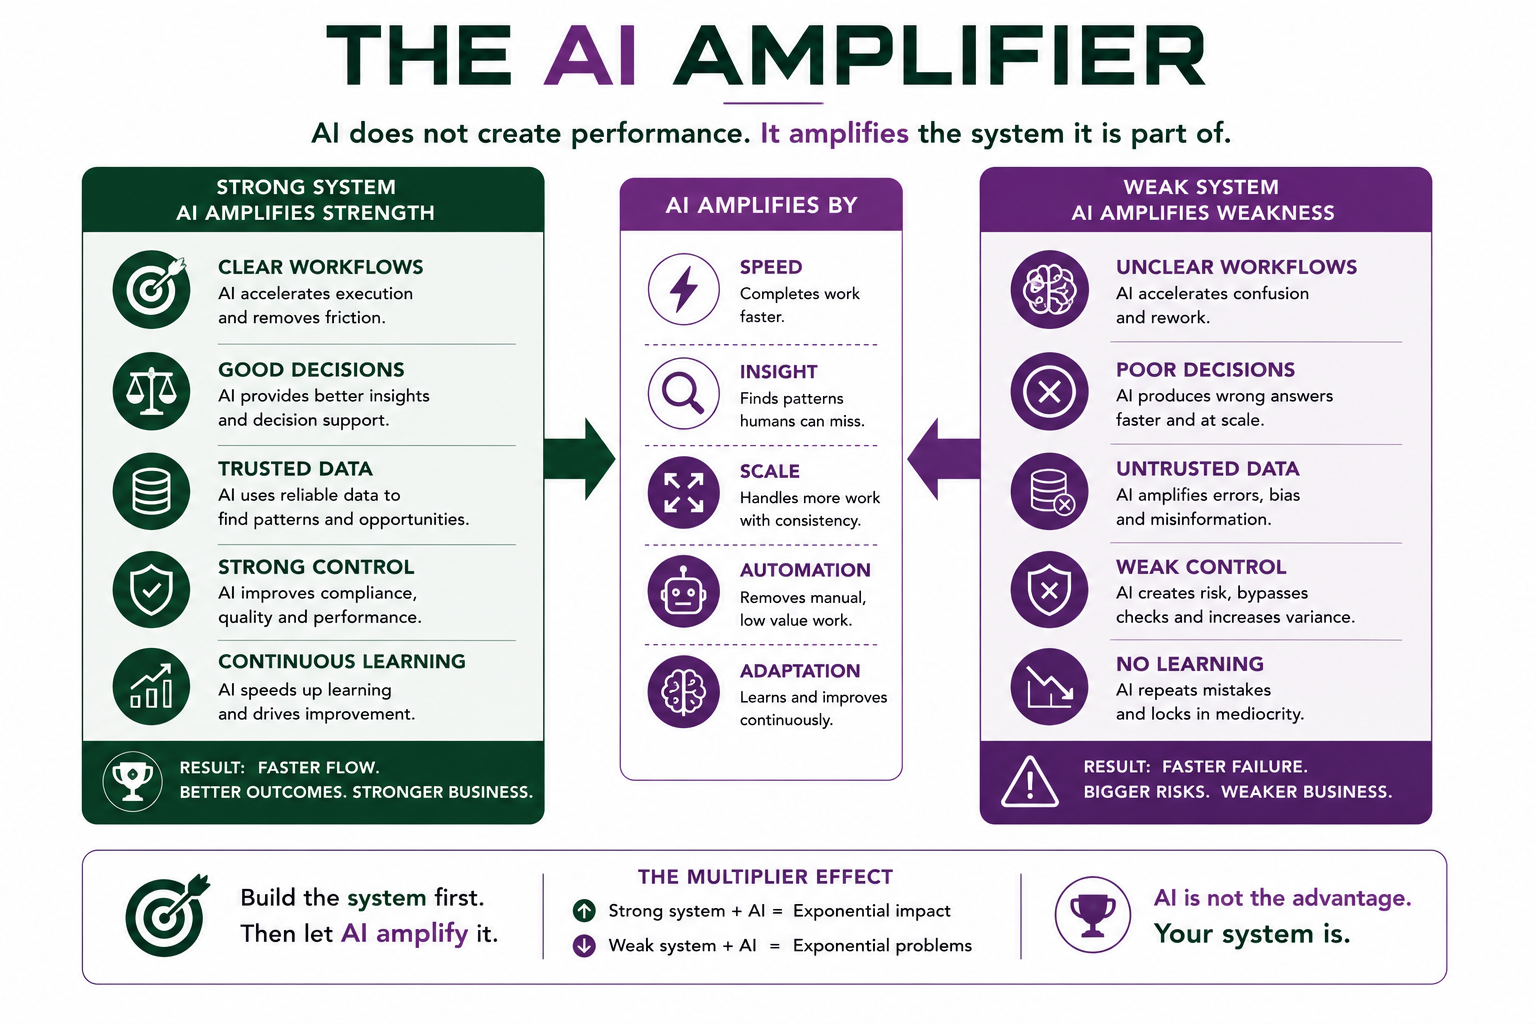
The AI amplifier
What AI does to a strong system, what it does to a weak one, and why the multiplier runs both ways.
Figure 11
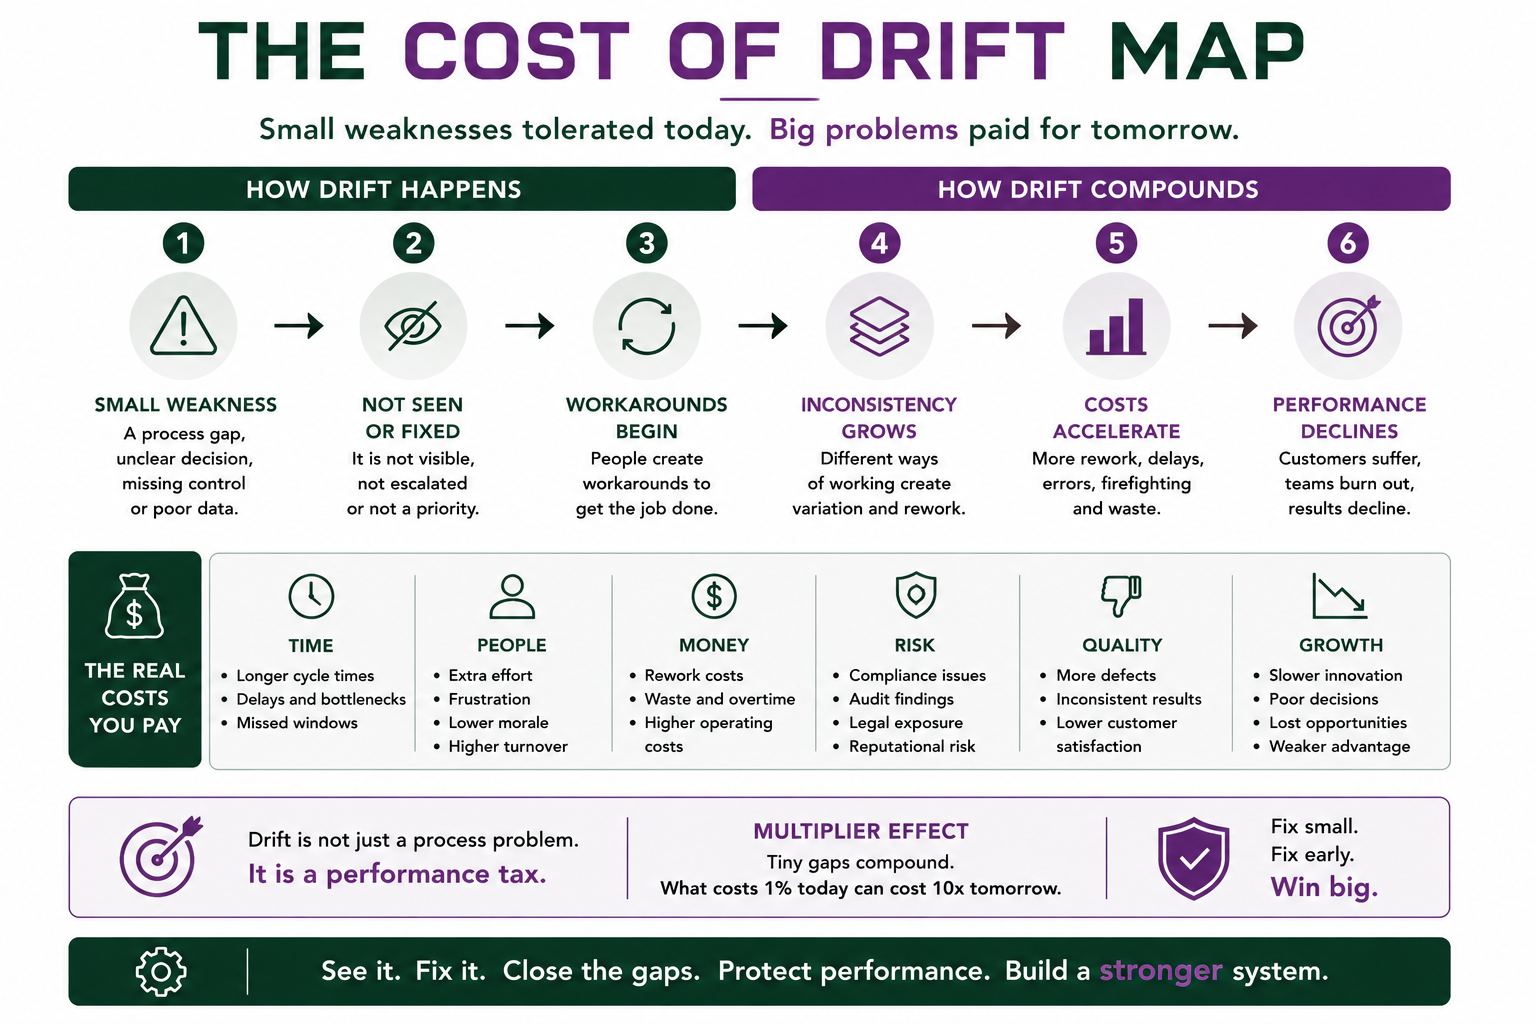
The cost of drift
How a small tolerated weakness compounds into a performance tax, and what it costs across six areas.
Figure 12
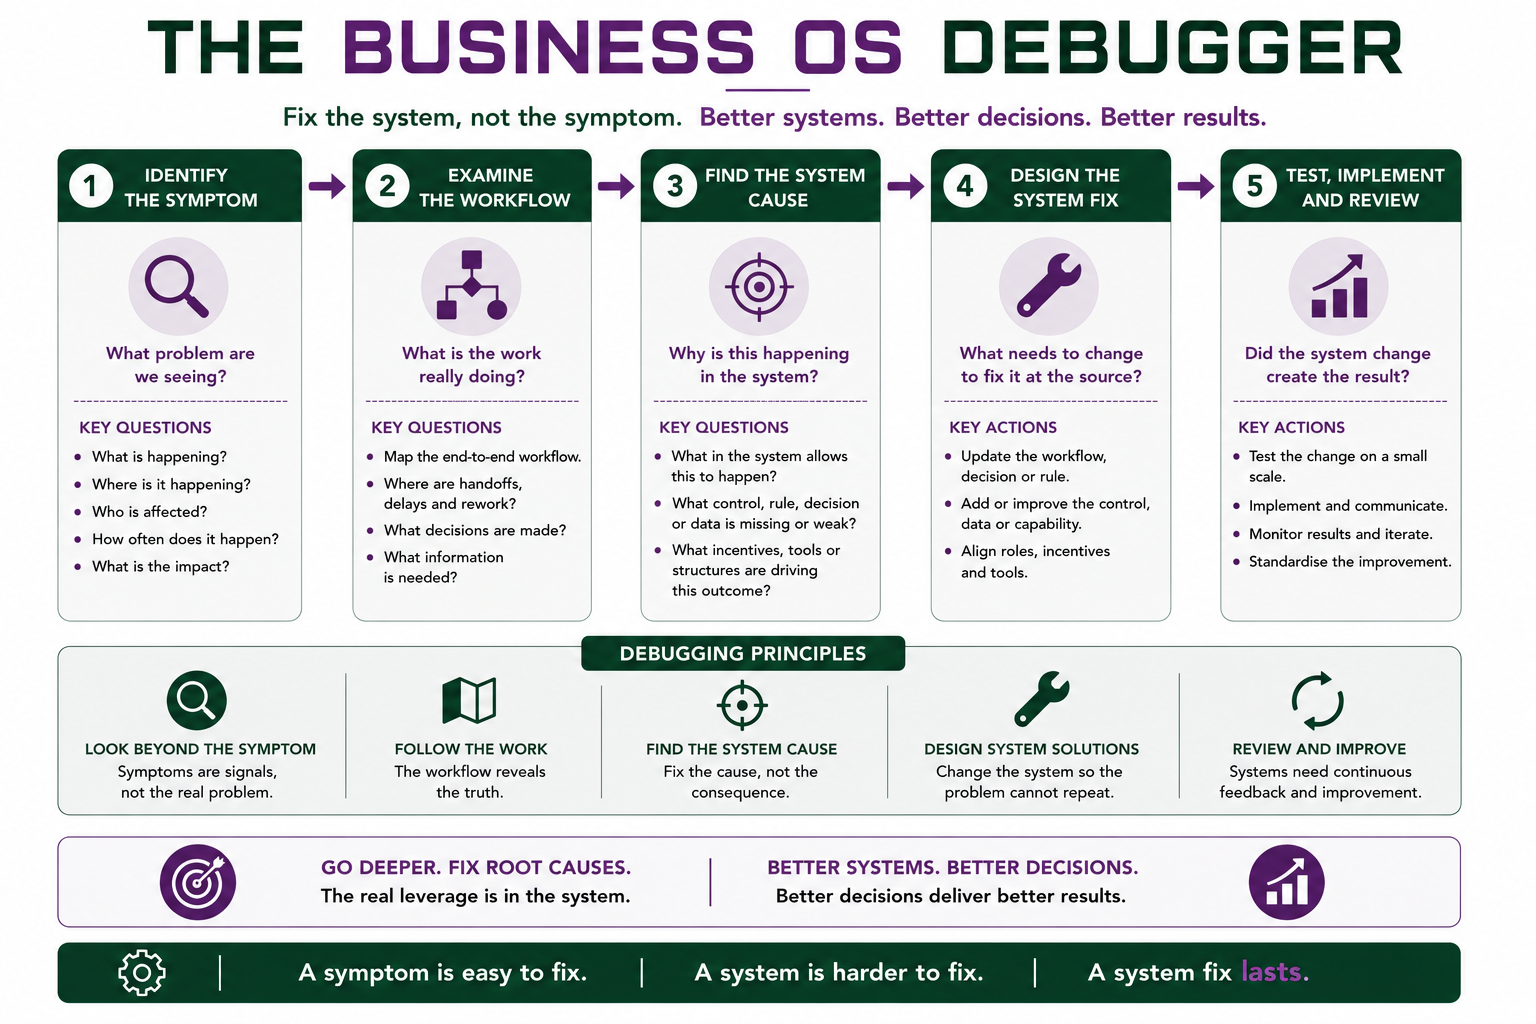
The Business OS debugger
Five steps from symptom to system fix, with the questions to ask at each one.
Figure 13
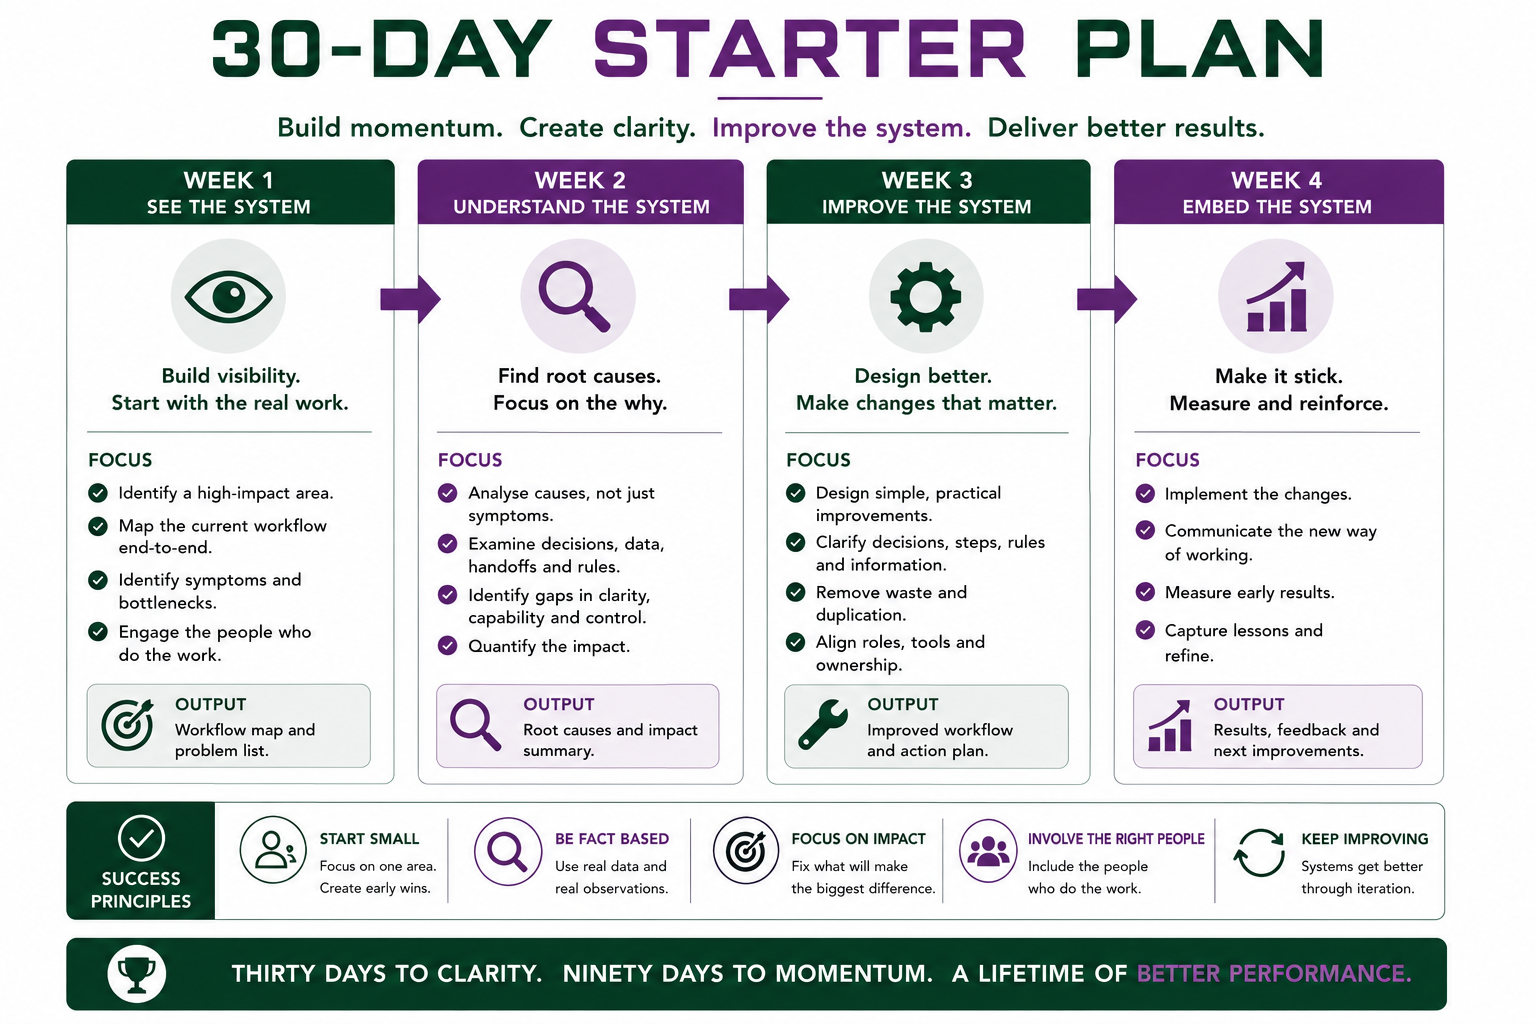
The 30-day starter plan
Four weeks from seeing the system to embedding a change, with the output expected from each week.



Doing something with them
Several of these are diagnostic. They were built to be used, not only looked at. The workflow X-ray, the cost of drift and the debugger are all built to be used against a real workflow in your own business.
The free guides take the same thinking further and produce a result you can act on.